Markov's Trilemma - Case Solution
This Markov's Trilemma case study introduces students to an easier Markowitz optimal-asset allocation model and identifying optimal-asset allocation.
Case Questions Answered
- Go to the worksheet "Three Asset Optimizer" in Exhibit 2. Note the stocks are arbitrarily weighted so that they each makeup about 1/3 of the portfolio. Go to Tools Solver. Most of the following parameters should be saved in the wizard box that pops up: your target cell is the Sharpe ratio formula; you are trying to maximize it by changing the three cells that contain your weightings with the constraint that the sum of your weightings equals 1. Hit Solve. Are the weights of the different assets in line with your expectations?Try the following actions and understand their consequences:♦ Suppose that GM has decided to become a diversified conglomerate, much like GE so that its correlation with GE will be 0.80 instead of 0.26. Rerun Solver using this new input. What happens to the weights and to the overall portfolio Sharpe ratio? Why?♦ Now, suppose that GM has decided to focus on automobiles and move away from anything that GE is doing (both with respect to businesses and markets) so that the correlation between GE and GM is expected to be as low as -0.80. Rerun Solver using this new input. What happens to the weights and to the overall portfolio Sharpe ratio? Why?♦ Suppose that GE's expected return for the upcoming year is 30% (instead of 41%), and its standard deviation is expected to be 30% (instead of 24%). How does your portfolio change if you use this new information?
- Assume again that the correlation between GE and GM is 0.26. Add the following constraints to the Solver model: (B6 ≥ 0; B7 ≥ 0; B8 ≥ 0), indicating that no shorting is allowed. What happens to the weights and to the portfolio Sharpe ratio? How does your portfolio change if you assume a correlation between GE and GM of 0.80 or -0.80?
- How does the base case optimal-portfolio Sharpe ratio change if shorting is not allowed and no asset can be allotted more than 50% of the total portfolio?
- How does your portfolio change if the risk-free rate goes down to 5% from the current 7%? Assume that shorting is not allowed.
- Replace GE with Intel in your three-asset portfolio. You can type over the GE ticker to import Intel's return and standard deviation. You must manually change the correlation matrix cells that were GE and now are Intel. What happens to the weights and to the portfolio Sharpe ratio? Which three assets would you use if you wanted to achieve maximum diversification if shorting is not allowed? What if shorting is allowed? (Choose the appropriate assets without making use of the Excel model.)
- How would you allocate your wealth between the Treasury bill (risk-free rate) and the optimal portfolio you have computed?
- How might you use this three-asset optimal allocation model to construct and graph an efficient frontier?
This case solution includes an Excel file with calculations that will be available after purchase.
This case solution includes an Excel file with calculations.
This Markov’s Trilemma case study introduces students to an easier Markowitz optimal-asset allocation model and identifying optimal-asset allocation.
1. Go to the worksheet “Three Asset Optimizer” in Exhibit 2. Note the
stocks are arbitrarily weighted so that they each makeup about 1/3 of the portfolio. Go to Tools Solver. Most of the following parameters should be saved in the wizard box that pops up: your target cell is the Sharpe ratio formula; you are trying to maximize it by changing the three cells that contain your weightings with the constraint that the sum of your weightings equals 1. Hit Solve. Are the weights of the different assets in line with your expectations?
In the basic case, the Correlation between GE and GM is 0.26
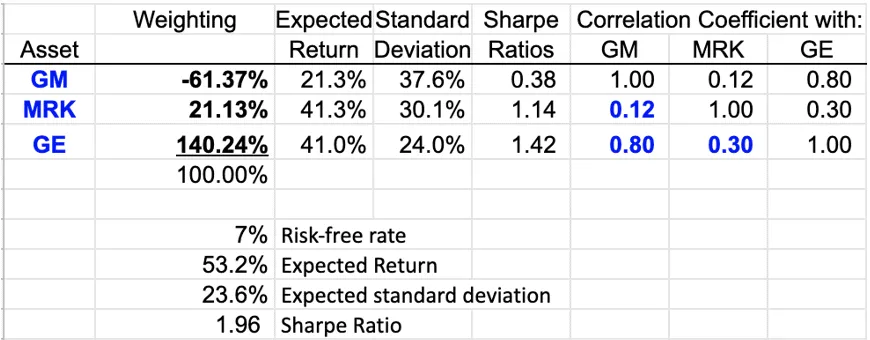
If the correlation between GM and GE changed from 0.26 to 0.80, the weight of GM changed from -0.7% to -61.37%, the weight of MRK changed from 34.7% to 21.13%, the weight of GE changed from 66% to 140.24%, the Sharpe ratio increased from 1.60 to 1.96.
Since the correlation between GE and GM increases, the optimal portfolio prefers to increase the weight of the asset with a higher expected return (GE) to maximize the Sharpe ratio.
♦ Now, suppose that GM has decided to focus on automobiles and move away
from anything that GE is doing (both with respect to businesses and markets) so that the correlation between GE and GM is expected to be as low as -0.80. Rerun Solver using this new input. What happens to the weights and to the overall portfolio Sharpe ratio? Why?
The correlation between GE and GM is -0.8
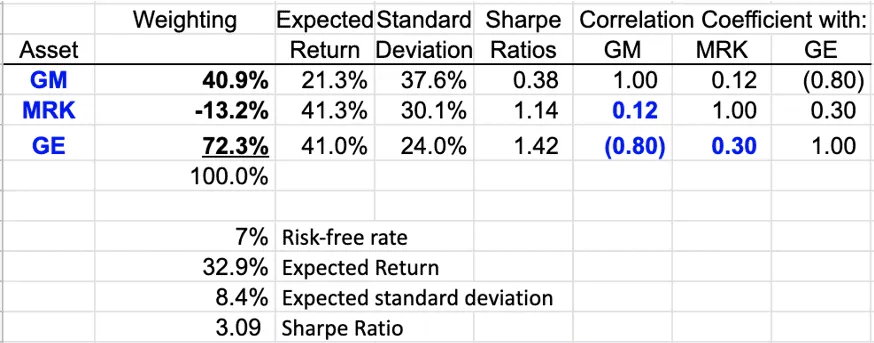
If the correlation between GE and GM is expected to be as low as -0.8, the weight of GM is 40.9%, the weight of MRK is -13.2%, the weight of GE is 72.3%, and the Sharpe ratio is 3.09.
Since the correlation between GE and GM is -0.8, the possibility of hedging increases, and there will be a diversification benefit. The weight of assets and the Sharpe ratio will change accordingly.
♦ Suppose that GE’s expected return for the upcoming year is 30% (instead
of 41%), and its standard deviation is expected to be 30% (instead of 24%). How does your portfolio change if you use this new information?
GE’s expected return is 30%, the standard deviation is 30%
- Full written analysis
- All case questions answered
- Excel spreadsheet included
- Instant delivery to your email
By clicking “Get Instant Access”, you agree to our Terms of Use, Arbitration and Class Action Waiver Agreement and Privacy Policy